In the world of product development and business operations, we are often drowning in data but starving for insights. For small businesses, this “data debt” usually lives in a sprawling web of disconnected spreadsheets.
To move from a mess of rows and columns to confident business decisions, we must master two fundamental processes: Analysis and Synthesis.
1. Analysis vs. Synthesis: The User Testing Perspective
Understanding the difference between these two stages is the secret sauce of effective user research and data management.
The Deep Dive: Analysis
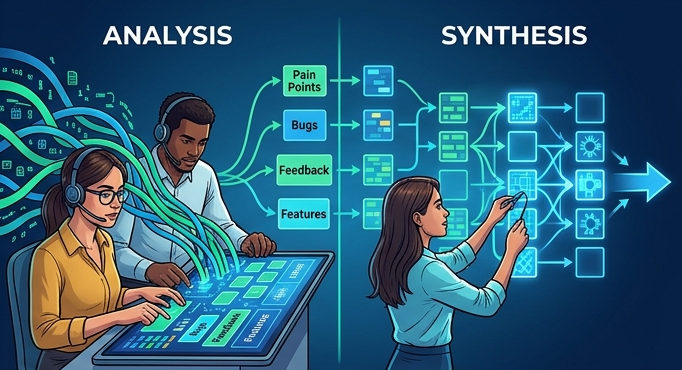
Analysis is the process of breaking a complex topic into smaller parts to gain a better understanding of it. In user testing, this looks like:
- Reviewing individual session recordings.
- Tagging specific pain points.
- Categorizing raw feedback into buckets (e.g., “Usability,” “Pricing,” “Bugs”).
The Big Picture: Synthesis
Synthesis is the act of combining separate elements to form a coherent whole. This is where the magic happens. We take the fragments found during analysis and look for patterns. Synthesis answers the question: “What does all of this actually mean for our strategy?”
2. The Problem: The “Spreadsheet Spiral”
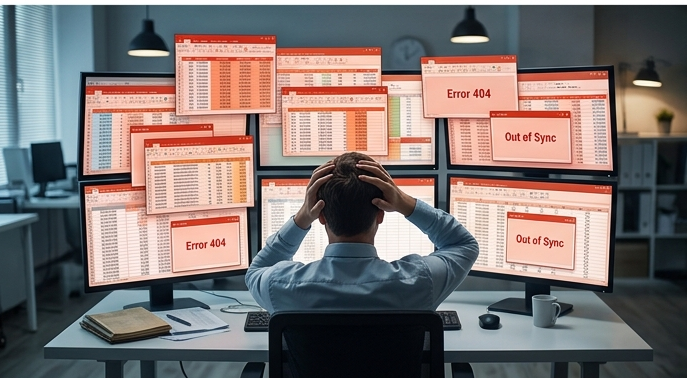
I recently collaborated with a small business that was hitting a wall. Their operational data—specifically their Work Orders—was trapped in a cycle of “Spreadsheet Spiral.”
The Challenges:
- Version Control Nightmare: Multiple versions of the same spreadsheet lived in different Folders, making it impossible to know which was the “source of truth.”
- Historical Drift: Tracking changes to historical data was manual and prone to human error.
- Data Desync: New incoming data didn’t talk to the old data, leading to fragmented reporting and missed deadlines.
“We spent 80% of our time just trying to clean the data and only 20% actually using it to run the business.”
3. The Solution: A Unified Data Engine
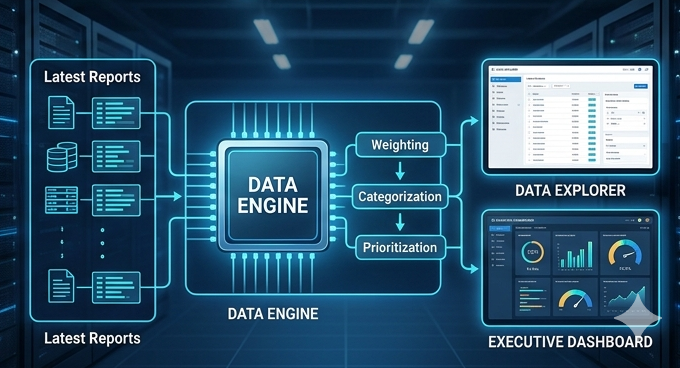
To solve this, I proposed a custom-built solution designed to automate the heavy lifting and surface the insights that matter. We moved away from manual entry and toward a streamlined data pipeline.
Key Features of the System:
- Automated Ingestion: The system pulls the latest report data automatically, eliminating manual copy-pasting.
- Intelligent Processing: Work orders are now automatically weighted and categorized based on priority and labor requirements.
- The Data Explorer: A robust interface where users can view, filter, sort, and find specific records in seconds.
- Instant Export: Need to take the data to a meeting? One-click export options keep the team mobile.
4. Accelerating Data into Action

The final piece of the puzzle was the Insights Dashboard. By synthesizing thousands of data points into visual KPIs, the leadership team no longer had to “guess” which work orders were lagging.
The Results:
- Speed: Decision-making moved from days to minutes.
- Accuracy: By eliminating manual synchronization, data integrity reached 100%.
- Proactive Management: The dashboard highlights trends before they become bottlenecks.
Conclusion
Data is only as valuable as the actions it inspires. By applying rigorous Analysis to understand the “what” and thoughtful Synthesis to understand the “why,” we transformed a struggling small business’s workflow from a liability into a competitive advantage.
Is your data working for you, or are you working for your data? It might be time to stop analyzing and start synthesizing.